RAWGraphs
RAWGraphs is an open-source web application that facilitates the creation of unique and custom data visualizations from various data formats.
Price: Free
Description
RAWGraphs serves as a bridge between spreadsheet applications and vector graphics editors, allowing users to quickly generate unconventional and beautiful data visualizations. Users can paste their data directly into the tool or upload CSV/TSV files, then map data dimensions to visual variables of various chart layouts. It's particularly useful for designers, data journalists, and researchers who want to explore data visually and create custom charts that go beyond standard graphing options.
RAWGraphs stands out as a free, open-source, and privacy-focused tool that processes data client-side, enabling the creation of highly customizable and exportable vector-based visualizations for publication and design projects. Its unique chart library encourages creative data storytelling.
How to Use
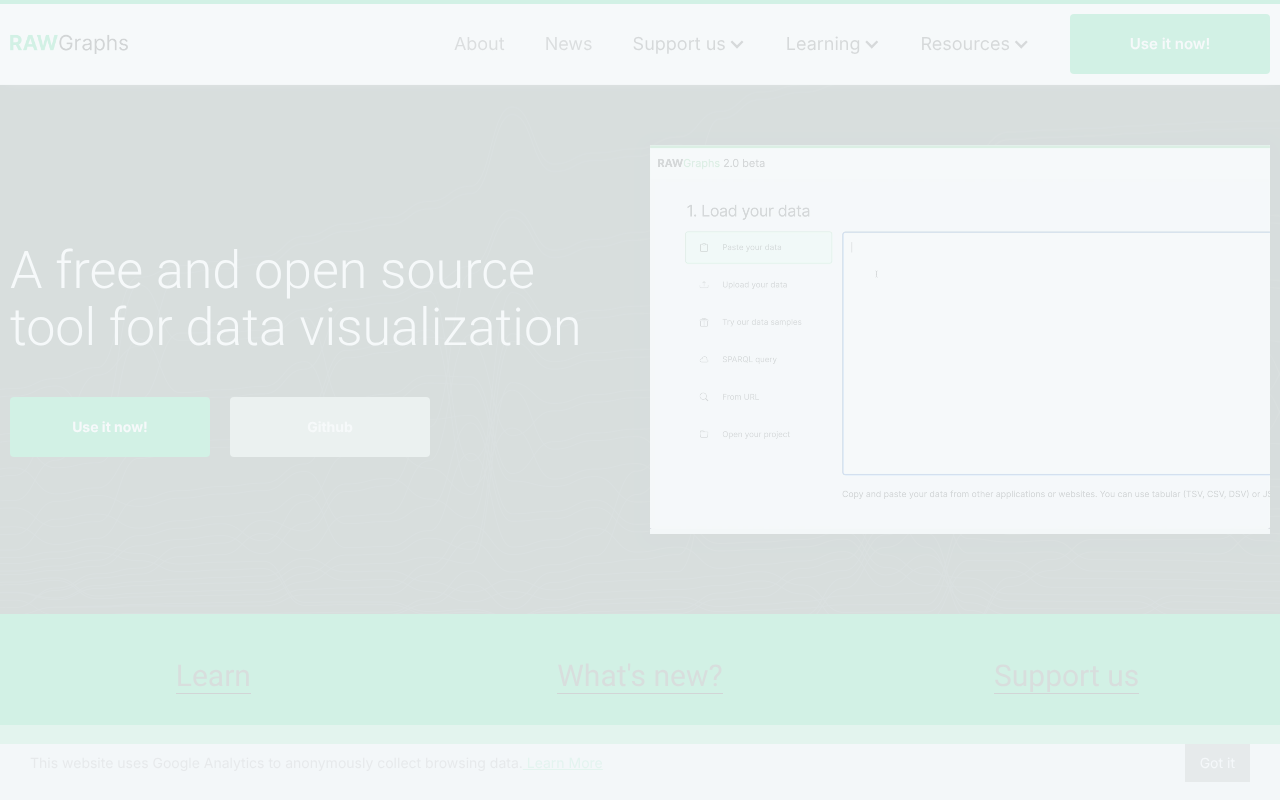
1.Visit the RAWGraphs.io website in your web browser.
2.Paste your raw data into the input area or upload a CSV/TSV file.
3.Choose a chart layout from the available gallery (e.g., Sunburst, Alluvial Diagram) that suits your data.
4.Drag and drop your data dimensions to map them to the visual variables of the selected chart, such as size, color, or position.
5.Customize the chart's appearance with options for colors, fonts, sizes, and other visual properties.
6.Export your visualization as SVG, PNG, or JSON for further editing in vector graphics software or for direct use.
Use Cases
Creating custom data visualizations for academic publications.Designing unique charts for data journalism articles.Exploring patterns in complex datasets visually.Generating vector graphics for infographic design.Producing non-standard chart types for artistic data representation.
Pros & Cons
Pros
- Completely free and open-source.
- Processes data client-side, ensuring data privacy.
- Generates unique and highly customizable data visualizations.
- Supports various input data formats (CSV, TSV, copy-paste).
- Exports high-quality vector graphics for professional use.
Cons
- Requires some understanding of data structures and visualization principles.
- No built-in data cleaning or advanced statistical analysis features.
- Interface might be less intuitive for absolute beginners compared to commercial tools.
Pricing
Free:
All features available
Unlimited data processing (client-side)
All chart types
Export options
No paid plans, usage limits, free trials, or refund policies as it's a free, open-source tool.
FAQs